Rare-disease AI: which signals actually hold up?
Rare diseases are not an ordinary classification problem. Few cases, many possible diagnoses, and very different data sources make it easy to produce impressive numbers for the wrong task. These experiments take the problem apart step by step. Moyamoya then serves as a concrete stress test.
Models for common diseases can learn from many similar examples. Rare diseases remove that repetition. The available evidence may consist of isolated case reports, small registries, or scattered images. At the same time, the diagnostic choice is not between two classes. It can span hundreds or thousands of disorders that share many findings.
This changes the central question. The highest score is not enough. We first need to know what information the model received, whether the comparison reflects clinical practice, and whether the learned signal belongs to the disease at all. A set of HPO codes, a clinical narrative, and a radiology image describe the same person in very different ways.
Three representations of the same case
HPO codes behave like a standardised checklist. Findings such as short stature, seizure, or microcephaly become discrete entries. This makes cases easy to compare, but removes order, negation, temporal development, and much diagnostic nuance.
Clinical prose resembles a detailed handover. It preserves the course of disease, uncertainty, and relations between findings. It can also reveal writing style, institution, publication format, and diagnostic work-up.
An image stays closer to the original observation. It preserves morphology and spatial relations, but also contains scanner text, cropping, modality, and publication layout. An encoder turns the pixels into a numerical vector. A linear model then learns a simple decision boundary in that vector space.
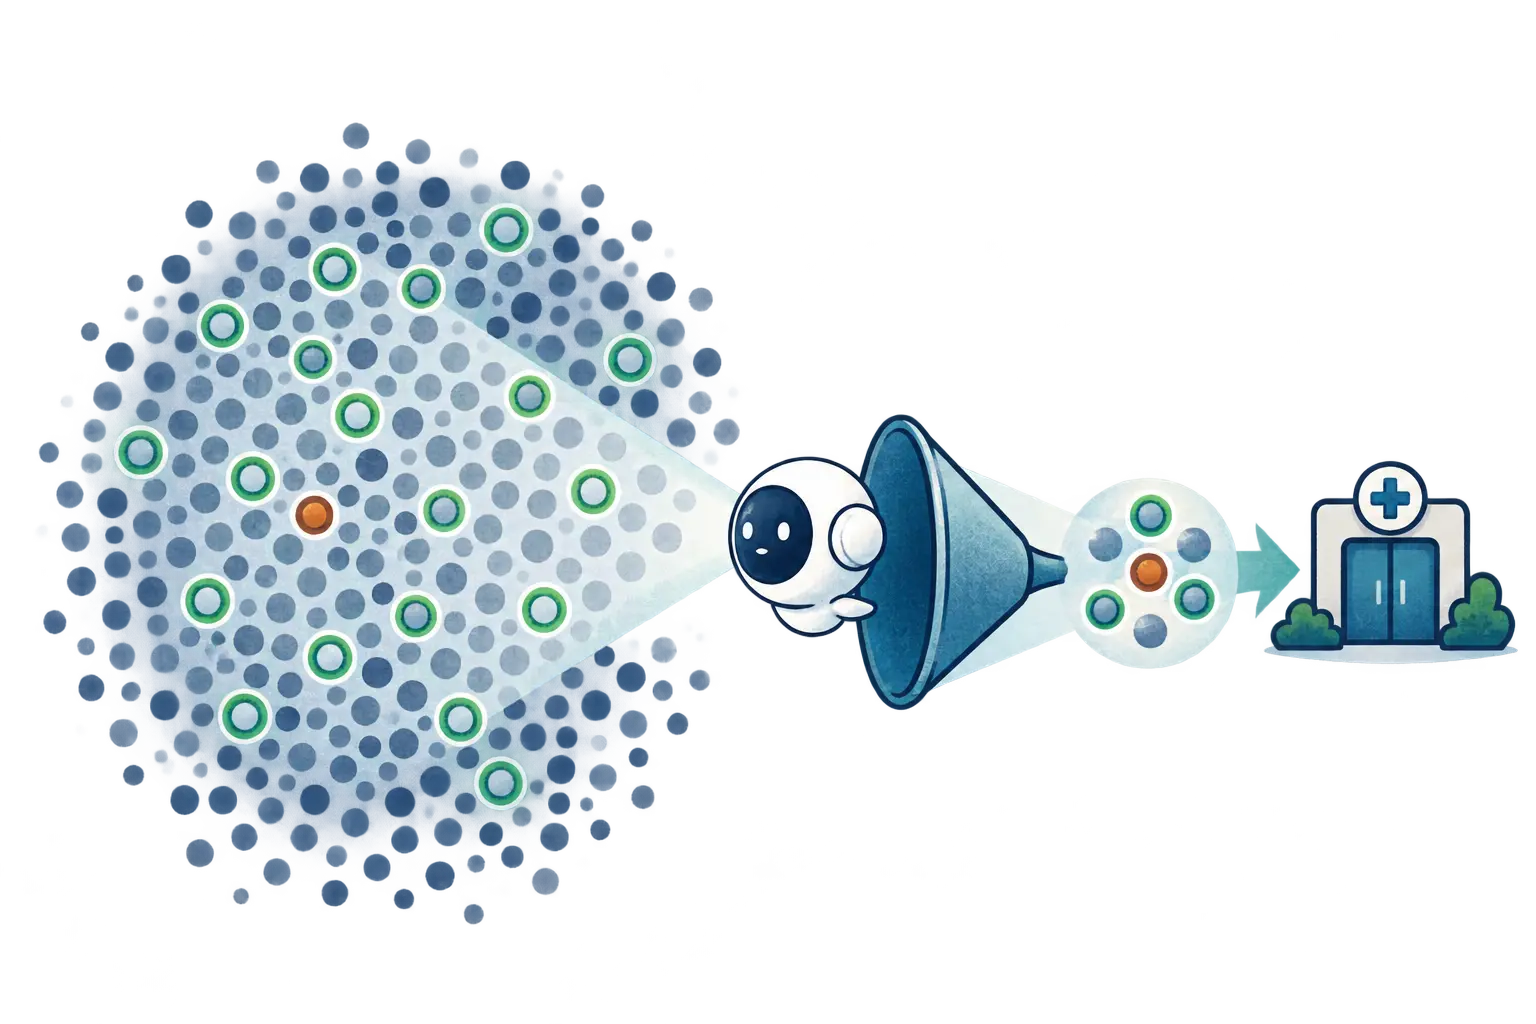
Reading order. The first chapters cover the general rare-disease experiments. HPO is the structured control. Text and images introduce unstructured signals. A provenance test asks whether the model recognises disease or data production. Moyamoya then becomes the in-depth clinical example.
The investigation in five steps
The investigation connects three questions: What can be learned from a few recurring cases? When do text and images carry diagnostic information? Can a focused signal for a treatable disease prompt specialist review? It uses public research datasets and synthetic examples, not identifiable patient data. The results come from different datasets and tasks; their metrics are not interchangeable.
1. Recurring diagnoses change the model comparison
In the RareBench comparison, a frozen foundation encoder feeds a thin linear decision layer. On the evaluated HPO task, the probe reaches about 0.80 top‑1. Knowledge lookup is around 0.15; the tested 14B and 122B language models reach about 0.49 and 0.36. This describes that data split, not a general rule that smaller models always win.
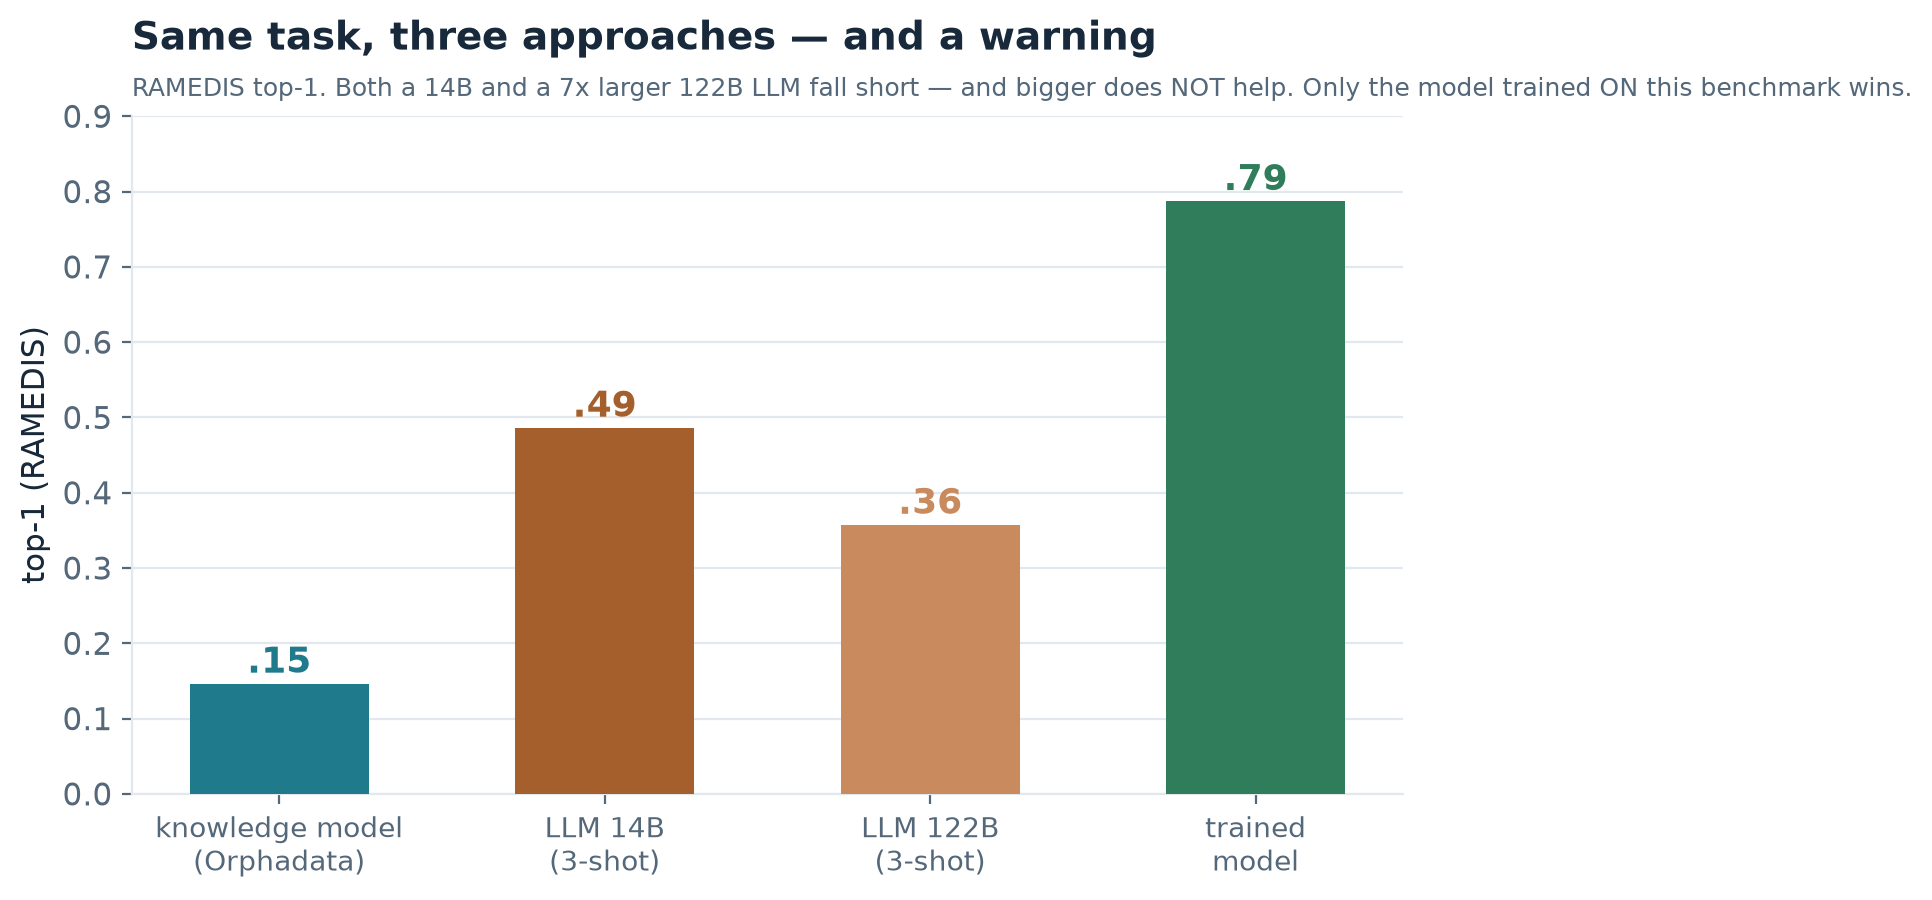
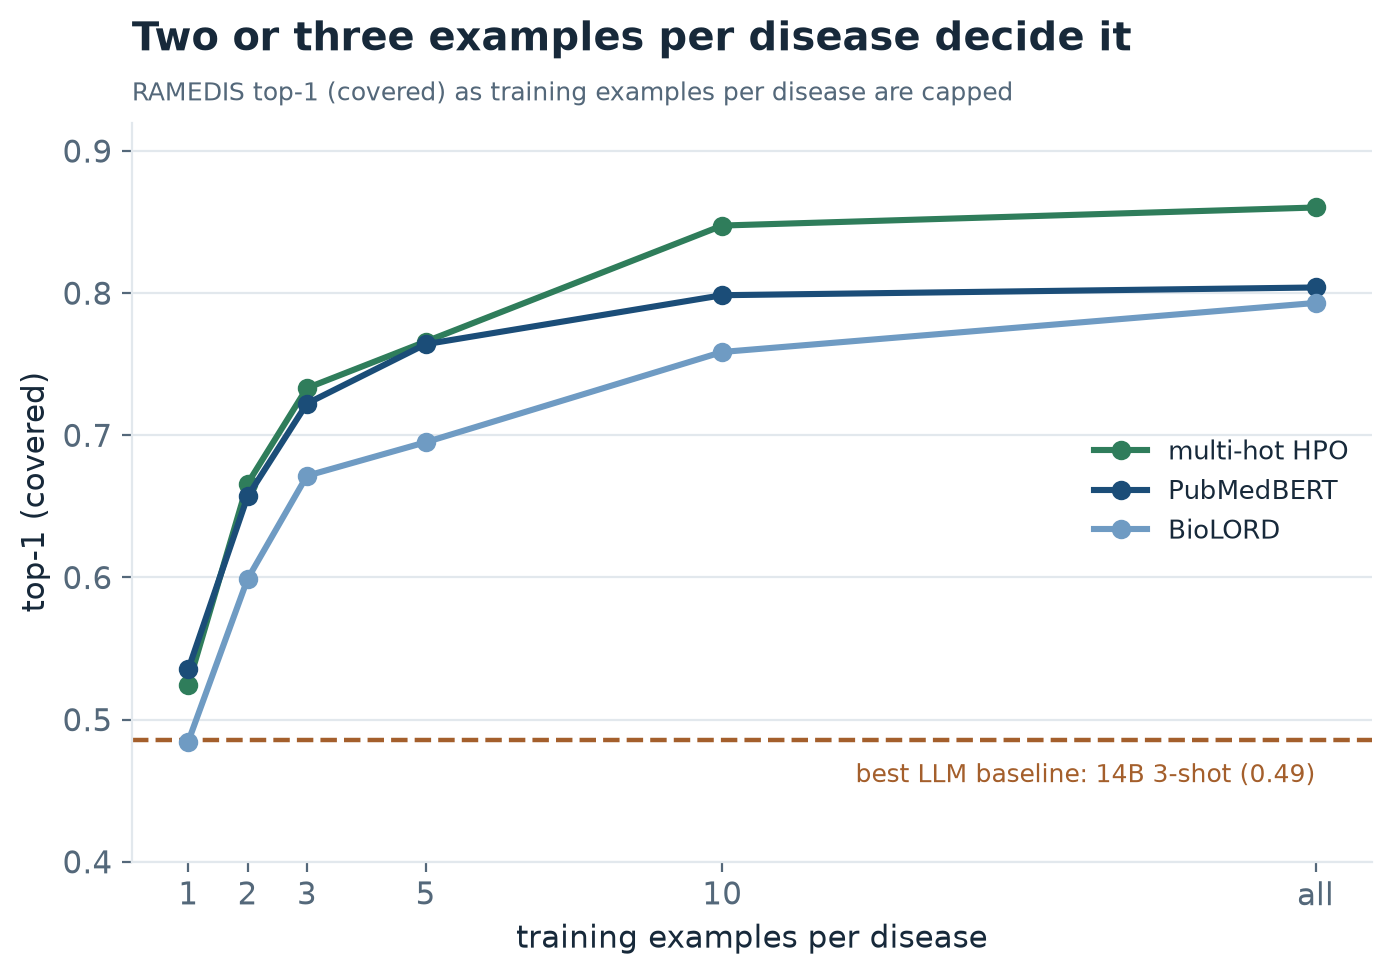
The advantage requires diagnoses to recur. With only one or two examples per disease, the methods overlap within uncertainty. The probe reuses a pretrained encoder’s general representations and adapts the final decision from a few cases. It does not solve the data shortage for one-off diseases.
2. Text and images help, with leakage checks
In the paired MMRareBench comparison (474 cases), top‑1 is about 0.31 for text, 0.21 for images, and 0.34 for both. The small gain is plausible: text captures the course, while images add visible features. But about one third of texts indirectly reveal the diagnosis through abbreviations or completed work-up. The text result is partly an upper bound, not a clean prediagnostic estimate.
Text leakage is even clearer in the Moyamoya case study: raw reports reach about 0.95 AUROC. Masking obvious diagnostic terms lowers this to about 0.90. Using only the history available before diagnosis drops the score to 0.47, near chance. The impressive raw-text result mostly reflects completed work-up and report context.
3. Moyamoya as a concrete test case
The image experiment uses open MultiCaRe case reports, which have no ready-made diagnosis labels. After a keyword prefilter, the reports were reviewed; prediction uses only the clinical presentation. The video analysis counts 91 confirmed Moyamoya cases and 646 vascular comparators. Images from each article stay in the same split.
In this analysis, the image model reaches about 0.86 AUROC; a metadata-only baseline reaches 0.59. After strict controls—head images only, arrows removed, views matched, and vessel images excluded—it remains about 0.84; in the smallest pure-tissue subset, about 0.77. On vessel images, the harder clinical distinction from other vascular diseases, it reaches about 0.71. Small samples mean substantial uncertainty.
Three shortcuts were tested directly: unrelated image regions, coloured arrows, and different views. A metadata-only baseline reaches 0.59 AUROC. Restricting to head scans, removing marked images, and matching views leaves the image model at about 0.84. In the strictest pure-brain-tissue subset without vessel images it falls to 0.77, with only 16 positive cases. On vessel images—the harder distinction from other vascular diseases—it reaches about 0.71. This supports an image signal, while uncertainty and small samples remain central.

Age and sex alone reach about 0.68 AUROC; the controlled image signal reaches about 0.84. It is about 0.76 for younger cases and 0.89 for age-matched atypical cases over 40, with only around ten positives per group. This is a reason to investigate further, not proof of reliable early detection.
A fair comparison with current clinical practice matters. The rough rule “young with a cerebrovascular event” reaches 0.62 sensitivity at 0.84 specificity. A learned model on the same features reaches 0.65 at the same specificity and can also be tuned to another operating point. Separately, age and sex alone reach 0.68 AUROC, curated clinical presentation 0.81, and the controlled image signal 0.84. These use different inputs and metrics and should not be treated as interchangeable.
4. An alert should prompt expert review, not diagnose
At very low prevalence, even a useful detector can generate many false alerts per true case. The video’s illustrative estimate is about 120 specialist reviews per true find in Europe and 13 in Japan. The proposal is a quiet second read of existing images; normal care continues and diagnosis stays with the expert team. Workload depends on prevalence and operating point.

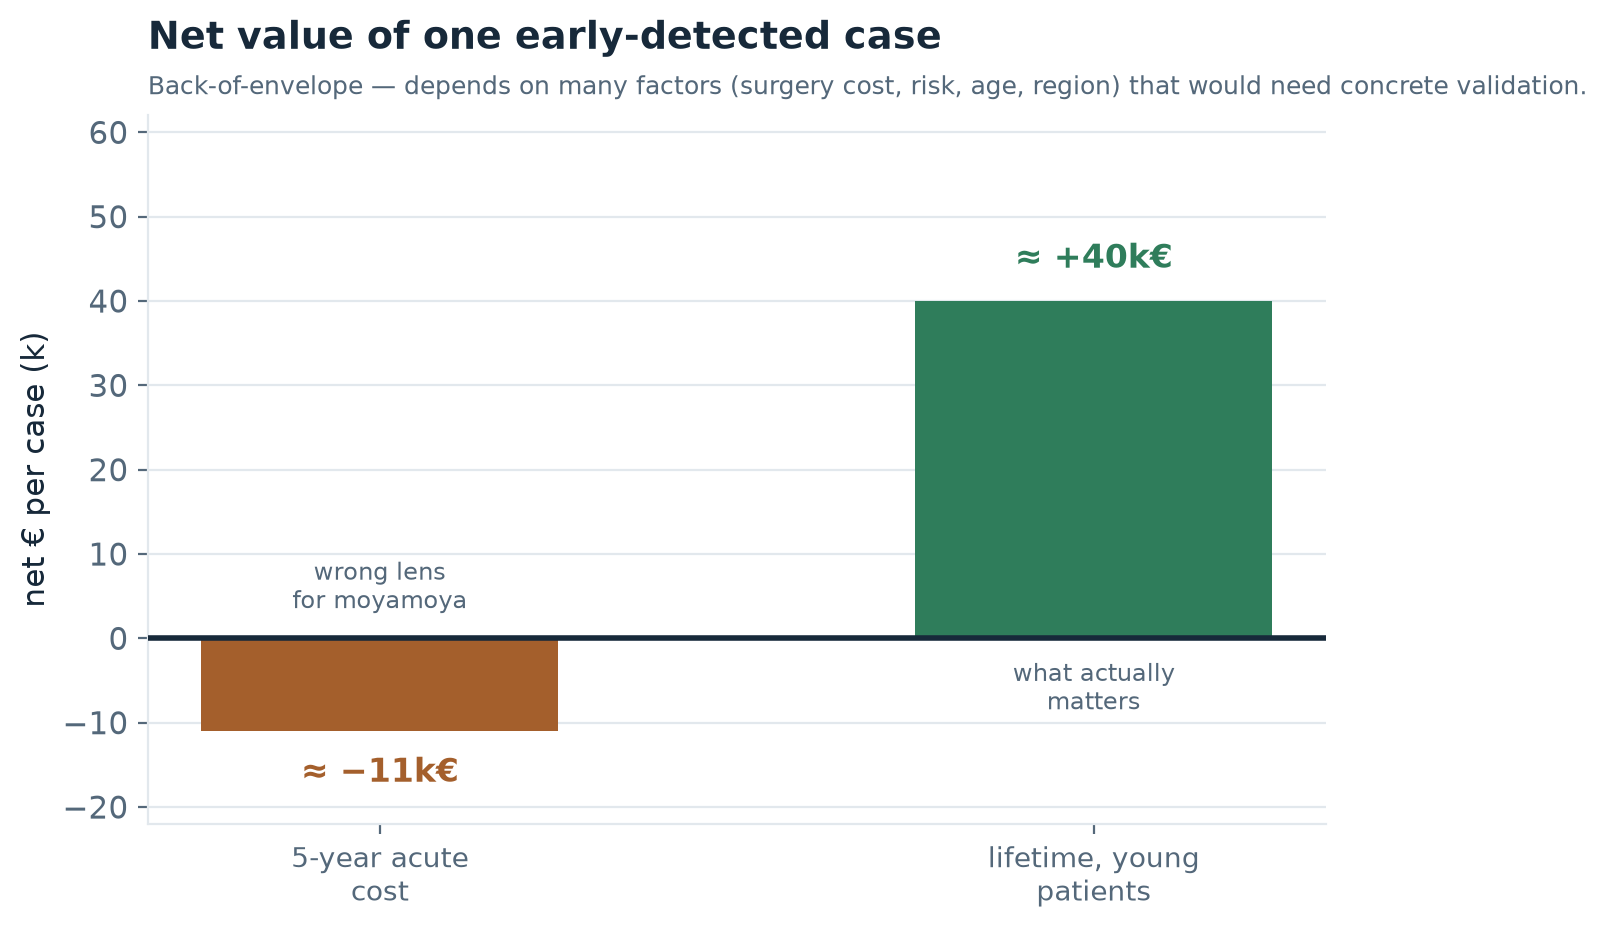
An illustrative high-sensitivity scenario raises modelled detection from 62% to about 87%, yielding around 38 additional early flags per year in a Japanese network. A rough economic calculation estimates about €40,000 of possible lifetime benefit per additional case. These are assumption-based projections, not measured impact or a health-economic evaluation.
The rough estimate depends strongly on the time horizon. A Japanese trial in haemorrhagic Moyamoya reported fewer recurrent bleeds after bypass. Over five years, avoided stroke costs alone may not offset surgery; potential long-term value comes mainly from preventing decades of disability in often young patients. The roughly €40,000 per-case figure is therefore an assumption to test, not a robust cost-effectiveness result.
5. What is missing before clinical use
A practical path could begin as a service: a simple clinical prefilter gathers suspected cases, experts confirm or reject them, and those decisions create clean labels. The model is trained on that dataset. Only later does it look for additional cases outside the prefilter and send them for review. Before a product is considered, a prospective real-world cohort is needed, including common stroke mimics and thousands of ordinary cases. Synthetic normal cases cannot reproduce that clinical overlap.
Published case reports are selective and incomplete. A prospective cohort from real care, including common stroke mimics, is missing. Synthetic normal cases cannot reproduce that overlap. The next steps are prospective expert-reviewed data, external validation, local calibration, and a study in the real care pathway. Only then can a medical device’s benefit and safety be assessed.
Epidemiology: Liu et al., Japan 2015–2019 · Birkeland, Denmark 2008–2017. Treatment for haemorrhagic Moyamoya: Japan Adult Moyamoya Trial.
Full narration transcript — 52 sections
01 · The Right AI for Rare Diseases
Imagine you've been ill for years, and no one can tell you what you have. For people with a rare disease, that's often everyday reality — on average it takes years to reach the right diagnosis. The great hope right now is artificial intelligence. But which AI really helps here, and how can you tell? That's exactly what we'll look at today, step by step and with honest numbers. An investigation by Sebastian Schmoll. And yes, the voice you're hearing is itself AI-generated.
02 · How big the problem really is
And here it's worth looking at the scale, because the word “rare” is misleading. There are around seven thousand different rare diseases. Individually each strikes only a few — but together around three hundred million people worldwide, more than cancer and AIDS combined, roughly one in seventeen. For those affected, a real diagnostic odyssey usually begins: on average four to seven years, three to ten doctors, often several misdiagnoses before a name is even settled. And even then, around ninety-five percent of these diseases have no approved therapy. About seventy percent begin in childhood. This is not a niche problem — it's one of the biggest unsolved questions in medicine. That's exactly why the hope placed in artificial intelligence here is so great.
03 · Can't we just ask the language model?
Let's start with the idea almost everyone has first. You take the whole medical report, dump it into a large language model like ChatGPT, and simply ask: what does this patient have? That sounds compelling. But here it gets hard, for one concrete reason: with rare diseases the choice is enormous — hundreds, thousands of possible diagnoses at once — and for most of them there are barely any examples anyone could learn from. Rather than guessing whether this works, we measure it. On real, already-solved cases where the right answer is beyond doubt.
04 · Why it's worth staying with this
Before we measure, three promises for why it's worth staying with this. First: a tiny, cheap model will beat the large language model — under one condition that almost no one spells out.
Second: on a real, treatable disease — Moyamoya — we see how an AI could spot cases years earlier, in time for an operation that prevents strokes.
And third, the uncomfortable part: three traps destroy almost every pretty AI number — leakage, base rate, and data provenance. We test each one mercilessly, and some numbers break in the process. Stay with us.
05 · Where the data come from — public research datasets
Briefly, what all of this rests on: exclusively public, citable research datasets, and everything actually measured. RareBench bundles around eleven hundred cases as standardized symptom codes with a confirmed diagnosis. MMRareBench brings four hundred seventy-four cases from real clinical texts and published images. MultiCaRe provides open case reports with image and text — from which we later build the Moyamoya case study. And Orphanet is a knowledge base with over four thousand diseases, for the lookup model. We never show real patient data, only synthetic examples. Let's start with the simplest format: the HPO-coded cases.
06 · Let's start simple: an HPO-coded case
Here's what such a case looks like concretely. Each symptom is stored as a standardized H P O code — Human Phenotype Ontology, a uniform dictionary for clinical signs, so that “seizure” always means the same thing, no matter which clinic wrote it down. This example is of course made up. It's on exactly such cases that we now measure the three approaches.
07 · Three approaches — measured on the same cases
There are roughly three ways to recognize such a disease. First, a trained model that learns the patterns from solved cases. Second, a knowledge model that looks things up in a kind of medical lexicon and needs no examples of its own at all. Third, the large language model from before, asked directly. As our measure we use top-1: is the correct diagnosis right at the top, at rank one? On a dataset with many recurring diagnoses, the trained model wins clearly, at about zero point eight — that is, eight out of ten correct. And to keep it fair, we asked the language model in two sizes — a medium one with fourteen billion parameters and a seven-times larger one with a hundred and twenty-two billion, both given examples. The surprising result: the smaller one actually does a bit better, just under half, while the huge one gets only about a third right. So bigger is not better here — and both stay far behind the trained model, while the pure lexicon trails off at one seventh. That's a fair comparison line, but not yet the state of the art like a frontier model. And still: by far the smallest, cheapest model wins. Why — that's what we'll see now.
08 · An example — what does each approach say?
Let's make it tangible with a made-up case — as HPO codes, exactly as the model sees it: recurrent seizures, developmental delay, a lactic acidosis, and a stroke-like episode. What does each approach say? The language model vaguely guesses a mitochondrial disorder, but rarely lands exactly at rank one. The trained probe model, which has seen similar solved cases, names MELAS at rank one. The knowledge model finds several fitting candidates, with no clear winner. This exact pattern is what sits behind the aggregated numbers from before. The outputs here are re-created, for illustration.
09 · Why the small one wins
Why does a tiny model beat the huge language model? The trick is simpler than you'd think, and it has a name: we build on top of a foundation model. But what exactly is that?
10 · The principle: a fluent employee, a short briefing
A foundation model is a model that was once trained on vast amounts of data and therefore already brings an enormous amount of general knowledge. Picture a new employee who already speaks the language fluently and knows the world — they don't have to start from zero.
This huge prior knowledge we freeze. Frozen means: we no longer change the large model, we only use what it can already do. That saves compute and, far more importantly, it saves examples.
On top we place only a wafer-thin decision layer, in technical terms a linear probe. It's nothing more than a weighted sum — the model merely learns which of the existing features point to our target disease. Like a short briefing for exactly one job, not a whole degree.
And that's exactly why just two or three examples per disease are enough to overtake the large language model. The large model brings the understanding, the thin layer on top only needs the final hint. The only thing that matters is whether even a handful of examples exists at all.
11 · Two or three examples make the difference
This chart shows it directly. To the right, the number of examples per disease; upward, the hit rate. On the left, where there are almost no examples, the small specialist has no chance. But exactly at the point where two or three examples come together, it flips, and it pulls past the comparison line of the large language model. The lesson is reassuring: little data is no obstacle — as long as there are at least a few. This matches, by the way, an earlier finding of ours on imaging models: small, lean models win precisely when data is scarce.
12 · But watch out — it flips with the data
Now the context that's almost always missing. This clear win holds only for a dataset in which diagnoses recur often — like a textbook in which the same disease appears on many pages. Add datasets that are more like a stamp collection, every disease a single specimen, and all three bars move together and their error bars overlap. Plainly put: the difference is then no longer statistically certain. So what matters is not the method alone, but how often a disease recurs at all.
13 · The open half — and why we continue anyway
Let's stay honest: for the truly unique cases, the ones that exist only once or twice in the world, there are no examples — and so no approach solves them reliably today. At this point one could give up. That would be the wrong conclusion, because we don't have to recognize every rare disease. Some are far more worthwhile than others: namely those for which, first, there is an effective treatment and which, second, are common enough that a few examples exist. For exactly this subset, the problem flips from unsolvable to feasible.
14 · Text, image, or both? — Bringing information together
Let's leave the single case and look at the general one. A patient rarely leaves only text — usually there are images too, an M R I or a microscopy finding. The idea behind this is called fusion: bringing both information sources together into ONE decision, instead of restricting yourself to one. Let's test it cleanly on four hundred seventy-four cases that have both. The written case alone carries the most, around thirty-one percent correct — because it tells the whole course.
The image alone is below that, at around twenty-one percent. A medical image shows only one moment, after all, while the text shows the whole story.
And now the fusion — both brought together. The model lays the clues from text AND image side by side and decides jointly, like two doctors comparing their notes: if they agree, you become more confident; if they contradict each other, it comes down to which one the model trusts more. The result lands only just above text alone, at thirty-four percent. So bringing them together is the right reflex — but here it gains little, because the image reorders the text list only in isolated cases.
15 · Can we trust the text? — the leakage test
A number is only as good as its fairness. The danger with text is called leakage: the model reads not the symptoms, but a word that already contains the answer. The naive test asks: does the diagnosis name appear verbatim in the case text? Answer: in only zero point four percent. Sounds immaculately clean. But this test is too trusting — the benchmark already replaces the diagnosis name with a placeholder, so a plain word search almost never finds anything.
So we tested exactly that with the experiment underlying this video: a language model reads each of the four hundred seventy-four cases for meaning and judges whether the answer shows through even without the exact word. The result is more uncomfortable than the word search suggested. In about two thirds of the cases there are only symptoms — there you really have to reason. But in about a third the answer is strongly telegraphed: sometimes by an unmasked abbreviation or a proper name, sometimes by a finding that fits only one disease. Plainly put: our earlier assumption that the text was essentially clean was too optimistic — which is why we measured. The text result from before is real signal, but partly an upper bound. And that's exactly why, for the real case, we'll build our own, clean label and rely on the image.
16 · Two case texts — and whether the text tells
Two made-up text snippets show the difference. The first contains only the medical history — young woman, recurrent circulatory disturbances, bilateral vessel narrowings; the model really has to infer, that's fair signal. In the second, the phrasing ‘following the T S algorithm’ appears in passing — an unmasked abbreviation that already gives away the answer, Takotsubo. Cases exactly like this make up those roughly thirty-five percent. (Re-created for illustration.)
17 · The idea: a quiet second reader in the background
What does the practical benefit look like? Like this: a quiet model running in the background while findings and images are being produced anyway. It watches only a short, curated list of treatable, sufficiently common diseases. And when it triggers, it doesn't merely whisper to the treating physician. It sends the case — independently of the acute treatment that's running anyway — to a connected expert for exactly this one rare disease, who gives it a targeted second review. Acute operations aren't disrupted; in parallel, the case gets a specialized second pair of eyes. Important: this is a thought model, not a finished medical device. Whether such a filter holds up depends on a number we'll test honestly in a moment.
18 · Let's make it concrete: Moyamoya
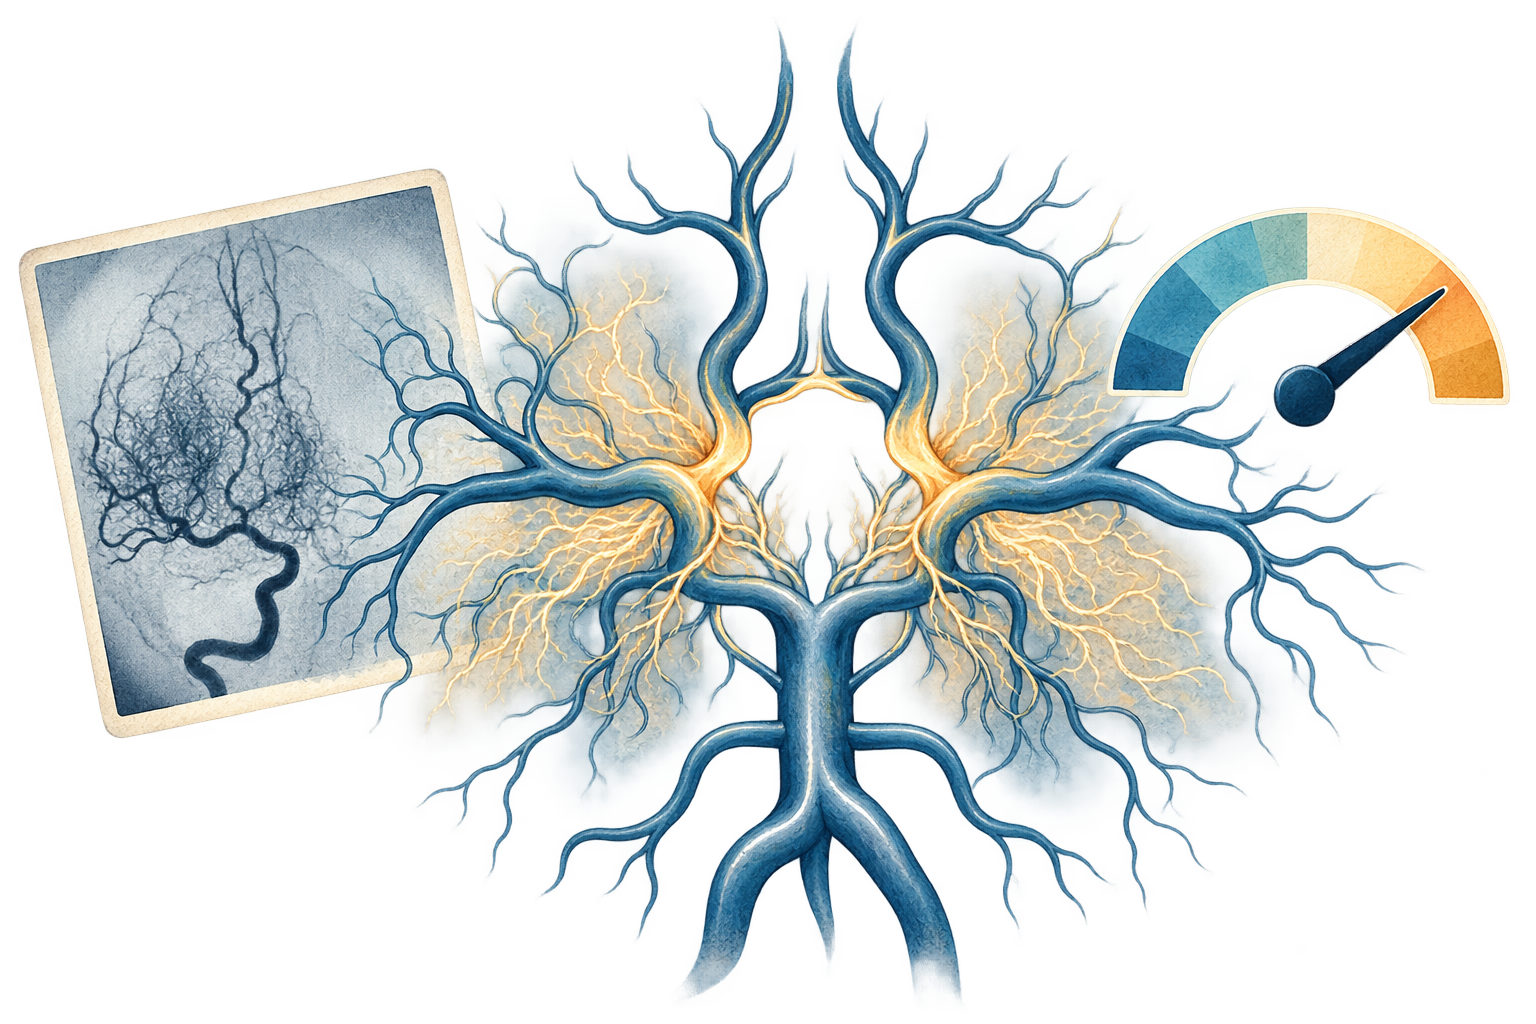
Let's take a real disease that fits this grid perfectly: Moyamoya. In it, the large brain arteries slowly narrow, and as an emergency fix the body builds a fine network of tiny bypass vessels. Untreated, it risks stroke or brain hemorrhage — including in children and young adults. But there is an operation, a so-called bypass, that provably lowers the risk. Treatable and detectable by imaging: an early hint here can change lives.
19 · The vessel pattern, schematic
So you can see what this is about, here's the pattern as a schematic. On the right, a healthy brain vessel branching cleanly. On the left, the diseased side: the large artery is narrowed, almost closed — and in its place a fine mesh of tiny bypass vessels proliferates. This cloudy network resembles a puff of smoke, and that's exactly what Moyamoya means in Japanese. The image is deliberately stylized and generated, no real patient data. In reality the cases look far more varied and messier: sometimes MR, sometimes classic angiography, sometimes CT. The model has to cope with all of it.
20 · The data basis for Moyamoya — honestly disclosed
And now fully openly, what the model trains on — precisely because that's half the battle. The data come from MultiCaRe, a published dataset of open case reports. Important and said openly: this dataset provides images, texts, and modality annotations, but no ready-made diagnosis label. So which cases are Moyamoya we had to determine ourselves — how, I'll show in a moment. In the end there are ninety-one confirmed Moyamoya cases against six hundred forty-six comparison cases. And crucially: we don't separate against healthy brains, but against vessel mimics like dissection or vasculitis that look deceptively similar on the image. That's the hard, fair task.
21 · How we get the label in the first place
So, how do you determine the label when the dataset provides none? The naive way would be to simply take every text that contains the word Moyamoya. That's exactly what we did first, as a rough prefilter — but this keyword method is noisy: a fifth of these hits mentioned Moyamoya merely in the differential or in a review, so they weren't actual cases at all.
Hence the clean step: we have a language model actually read each case report and decide whether this patient was really diagnosed with Moyamoya. The label comes from the whole report including the diagnosis; the features we later predict from come only from the presentation — so no circularity.
After that we filter the images cleanly by region, view, and color, and finally split by article so that no two images of the same case slip into both training and test. Only on this prepared basis do we measure.
22 · Does the model really look at the vessels?
Before we trust any number, a serious question. Does the model really recognize the disease, or does it cheat by telling from the image border or a particular clinic's layout where an image came from? That would be like a student who doesn't know the right answer but can tell from the worksheet's watermark which answer book it came from.
Against this we set a test. We deliberately intervene in the image. Once we show only the vessel region — so the spatial pattern is preserved. Once we cut the image into four tiles and view each on its own — which tears apart the continuous vessel course.
The hypothesis is clear: if the model really reads the connected vessel pattern, its performance must collapse once we cut that connection apart. If it stays the same, it probably learned something else, something telltale.
23 · Where the image signal comes from
And that's exactly what happens. Briefly, what A U R O C means: it measures discrimination — how well the model separates the sick from the not-sick. Zero point five is pure guessing, one point zero would be perfect. The full image and the pure vessel region are at the top, at around zero point eight five to eight six. The cut-up tiles drop off clearly, because they lack the vessel course. This pattern is the proof: the model looks at the right thing, the real vessel morphology, not a trick at the image border.
24 · The toughest counter-check: out with the confounds
Now the sharpest test of the entire case study, and it arose from genuine suspicions while looking into the images. Three traps lurk: some comparison images aren't brain images at all, but thorax or neck. On some positives an arrow drawn in afterward points at the finding. And positives are more often vessel scans, negatives rather normal cross-sectional images. Each of these traps the model could abuse as a shortcut. Let's set a baseline: a model on metadata alone — modality and number of figures — reaches zero point five nine. That's how far the pure distribution trick carries.
The image model on the clean LLM label is at zero point eight six — clearly above the metadata baseline.
Now the sharp counter-check: we keep only head scans, delete every figure with colored arrows, match the view, and even throw out all vessel images — what remains is pure brain tissue. And the decisive part: the number barely drops, it holds at zero point eight four. So the confounds weren't the driver; the signal really sits in the tissue. The actual limit remains the small case count, only sixteen positives in this strictest subset, so a wide confidence interval.
25 · Two separate classifiers — the honest comparison
Taken as two separate classifiers, not mixed: on pure brain tissue the model separates Moyamoya from the other cases at zero point eight four.
And on the pure vessel images, where it has the genuinely interesting task — distinguishing the Moyamoya pattern from other vessel diseases like dissection or atherosclerosis — it reaches zero point seven one. Precisely this clinically hardest distinction is only moderate. Both numbers are real, both modest, and the confidence interval is wide because there are only about three dozen confirmed cases.
26 · No fluke: robust across twelve image encoders
So that it doesn't hinge on the luck of a single model, we tested twelve different image encoders. An encoder is the building block that translates an image into numbers a model can compute with. The best, a small DINOv2, is at zero point eight five.
A newer DINOv3 follows at zero point eight two.
The mid-sized variants are around zero point eight.
The large ones also stay in this range — bigger is not better here.
And even the weakest, a medically pre-trained model, is still at zero point seven two. Important for context: these are the raw, not-yet-deconfounded numbers — they only show that the effect isn't the fluke of a single model. The robust number is the confound-controlled one from the counter-check: when we factor out non-brain images, drawn-in arrows, and view differences, the discrimination stays at zero point eight four. Only in the very strictest cut — pure brain tissue only, every vessel image removed, only a few cases left — does it drop to zero point seven seven. So in both cases real signal, no artifacts.
27 · The image beats demographics alone
And now the fair comparison against demographics. Age and sex alone, measured robustly across all cases, separate Moyamoya at zero point six eight.
The image, by contrast — and computed fairly, i.e. confound-controlled — separates at zero point eight four, clearly better than demographics alone. So the image doesn't just learn who is typically affected, but carries real additional signal from the brain tissue. Moyamoya does affect young women disproportionately, but the image signal doesn't reduce to that.
28 · The patient the heuristic misses
And with that to the most interesting question of all: what about the patient who doesn't fit the pattern? The older one, where no one thinks of Moyamoya first? That's exactly where it's decided whether an image model adds real value or merely parrots the demographics.
29 · But: the image shines exactly where demographics fail
And now the twist that shows the real value. Let's split by age. For the young patients, whom an age heuristic flags anyway, the image is only moderate, zero point seven six — here it adds little over the rule.
But for the older, atypical patients — age-matched so the demographics no longer give anything away — the image jumps to zero point eight nine. Exactly where the simple rule is blind, the image carries the most, presumably because older cases show more established tissue damage. So the image doesn't just parrot young-equals-Moyamoya; it complements demographics precisely where they fail. For context: only about ten positives per group, so a wide confidence interval, but the direction is clear and clinically sensible.
30 · The atypical case — what each approach says
And now to the heart of the case study, very concretely. A made-up but typically difficult case: forty-eight years old, so really too old for the classic suspicion, a routine MRI after a transient circulatory disturbance. The simple demographics rule says: not young, no suspicion — and misses him. The image AI on the tissue triggers and puts him before the specialist. If the vessel imaging confirms the pattern, the case is caught early. Exactly there, with the atypical patient, lies the added value. (Re-created.)
31 · And the text? Suspiciously good — here leakage strikes
Remember that MMRareBench text was clean? With Moyamoya it's the exact opposite — which is why you test it per dataset. The raw case text separates Moyamoya with a discrimination of zero point nine five, almost perfect, better than the image. That's suspiciously good, so we peel away the telltale parts layer by layer.
First layer: we redact the obvious diagnostic terms, such as the name of the operation. The number drops to zero point nine.
And the kicker: once only the real history remains, what you'd know before the diagnosis, the number falls to zero point four seven — a coin flip. The strongest words were Japanese ones and terms from the already-completed workup. The model guessed who the patient is and read along the finished diagnostics. Here almost everything was leakage.
32 · Beware the pretty number
Before we talk about benefit, a warning that most success stories lack. Look at what this chart shows: for every single rare disease we built our own small detector — each bar here is exactly one of them. Its task: distinguish this one disease from the other rare ones in the dataset. And almost every bar is near the very top, the vast majority above zero point nine five — a whole wall of top marks. Sounds solved. But it isn't — and the next step shows why.
33 · But the task was too easy
Against whom did the detector win? Picture a bouncer who tells thirty regulars apart blindfolded, flawlessly. Impressive — except that's an empty room with exactly those thirty. That's precisely what the task was here: separate one rare disease from other rare ones that look completely different.
The real task is a different one: spotting that one regular in a full stadium of ten thousand strangers. That is, fishing out the rare disease among thousands of ordinary patients. Against this realistic mix, the discrimination falls from almost perfect to zero point seven to eight.
34 · What an alert really costs — the base rate
And even that zero point seven to eight is deceptive in practice — because of the base rate, that is, simply how rare the disease is at all. What this curve shows: the rarer the disease, toward the left, the tinier the share of true hits among all alerts. Let's work it out concretely for Moyamoya in Europe, at the chosen operating point. For the model to catch nine out of ten real cases, a specialist has to review around a hundred and twenty flagged scans to find a single real Moyamoya case. A hundred and twenty to one. Sheer rarity beats good discrimination — that's pure probability, and it holds for every rare disease. At this point most would bury the project. Wrongly, as the next three steps show.
35 · The model replaces no one — it hands off
Before we despair at the base rate, the decisive shift of perspective: this model doesn't have to make any diagnosis at all. It only has to hand the right case to the right person.
36 · It doesn't have to diagnose — just flag
And this is exactly where the base rate is defused. The trick is not to have fewer false alarms — but to make them cheap. Because the model makes no diagnosis, but only marks an already-made scan as suspicious, a false alarm costs merely one additional specialist glance. No wrong verdict, no harm. That makes even a hundred and twenty reviews per real case bearable instead of fatal — it's specialist time, not risk.
On an alert, a specialist decides, just as today; the patient's normal treatment runs on completely unaffected in parallel. The model replaces no one and diagnoses nothing — it's just a second pair of eyes that would otherwise have been missing.
And from that follows a second, independent advantage. Because the model only marks, it doesn't even have to understand why someone has Moyamoya — a mere correlation suffices, no causation. That's no free pass, but it lowers the clinical and regulatory hurdle considerably compared with a system that diagnoses itself. The data scarcity from earlier, by the way, this does not solve — that we solved separately, by restricting ourselves to treatable, recurring diseases.
37 · The same algorithm, a completely different value
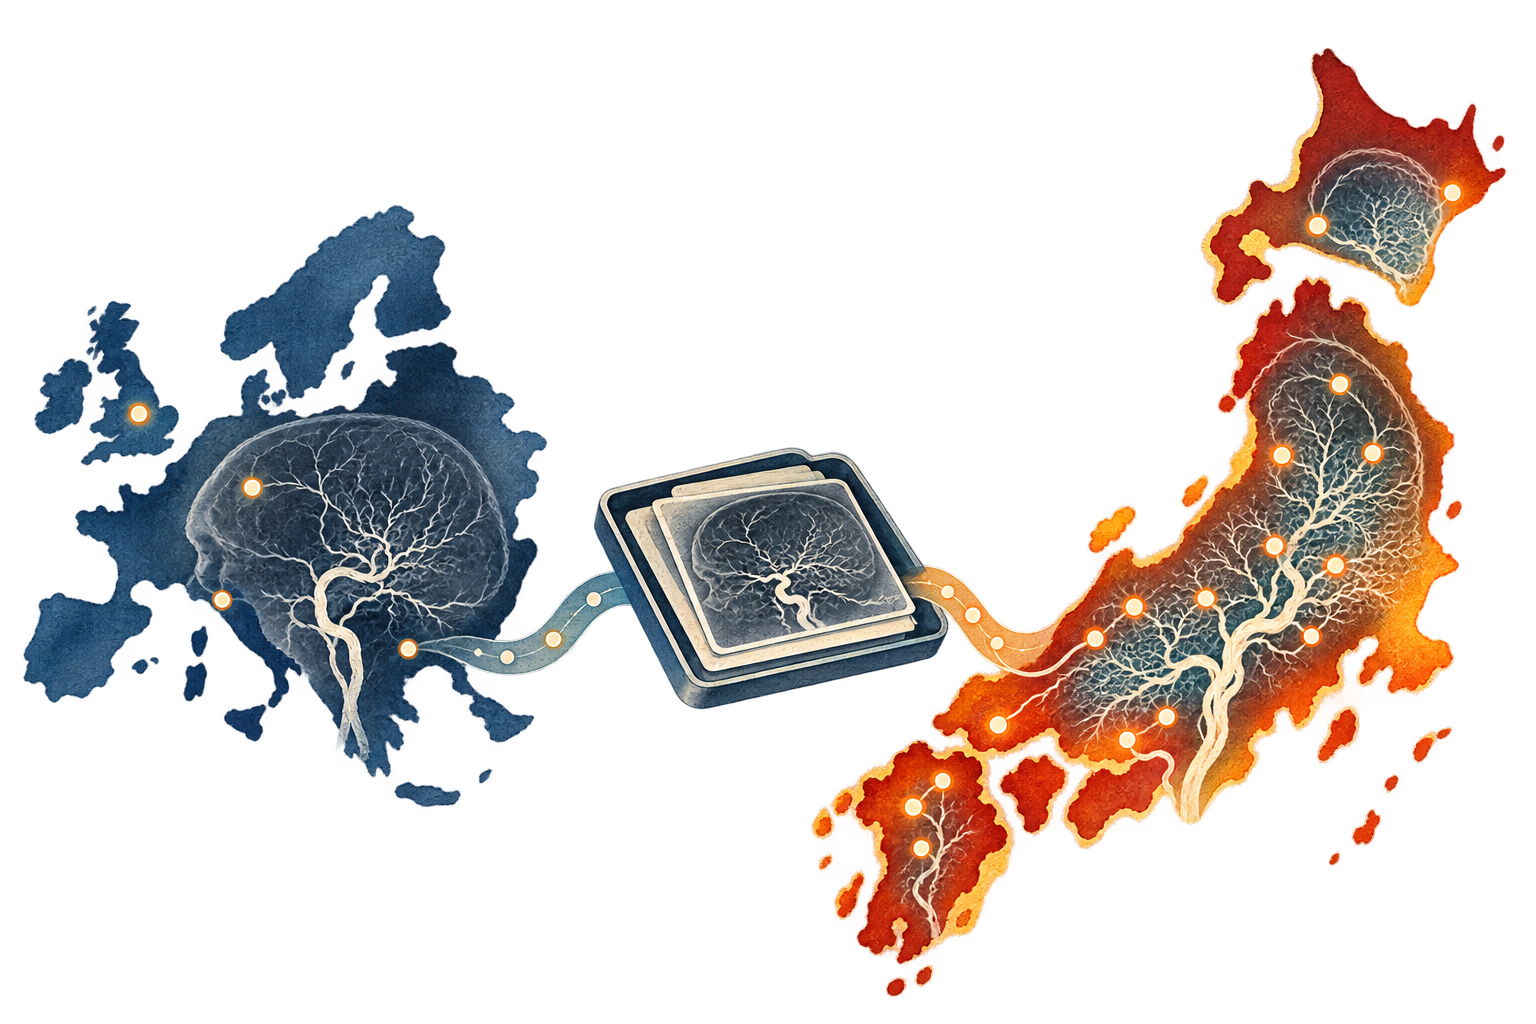
And now the lever that turns an unusable solution into a valuable one: geography. Moyamoya is about thirty times more common in Japan than in Europe. At the exact same operating point, with the same model, the load drops from about a hundred and twenty reviews per real case to only about thirteen. Reviewing thirteen flagged scans to catch one real Moyamoya case early — that's suddenly entirely within what a specialized center can manage.
38 · The business case, broken down
Let's break down the whole business case. First, the volume: a care network for seven point six million people sees, at Japanese incidence, around a hundred and fifty new Moyamoya cases a year — in Europe it would be only about five. Second, the load: in Japan a specialist has to review only about thirteen flagged scans per real find, in Europe a hundred and twenty. Third, the yield: at the chosen operating point the model catches nine out of ten cases. And fourth, the decisive one: Moyamoya is treatable. In a study on hemorrhagic Moyamoya, the annual rebleeding rate fell markedly with a direct bypass. Put it together: a hundred and fifty early-flagged cases a year, with a reasonable review effort, triggering an operation that prevents strokes. That's no longer a pretty benchmark — that's a reason to actually build such a thing in a Japanese center.
39 · Where does the AI step in, in everyday clinical practice?
Let's make it fully concrete: how does such a model fit into real everyday clinical practice? The key is that the decisive data arise anyway. Let's follow a patient's path.
40 · The Moyamoya path — and everywhere AI could intervene
Let's look at the typical path of a Moyamoya patient. At the start are symptoms, often a transient circulatory disturbance or a stroke. So a routine scan is done, a CT or MRI, which arises anyway. A radiologist reads it — and here subtle cases get lost. Only on suspicion does the dedicated vessel imaging follow, then the diagnosis by the specialist, and finally the bypass that lowers the stroke risk.
And now you can see that AI could intervene at several quite different points, depending on the data available. A text AI on the history flags right after the account. An image AI on the routine scan catches exactly the cases the radiologist misses. And a vessel AI on the angiography separates the Moyamoya pattern from other vessel diseases. How strong each point is, we'll see in detail next.
41 · Status quo vs. learned model — measured fairly
Before we talk about AI's added value, the most uncomfortable question of all: does a learned model even beat the simple rule clinicians already apply today? For this we implemented the clinical suspicion rule itself as a classifier and measured it on the same test data.
42 · Does the model beat the clinical rule?
Today's rule, roughly: young patient with a cerebrovascular event, then think of Moyamoya. As a classifier it catches zero point six two of the cases, at a specificity of zero point eight four. So: nearly four out of ten Moyamoya are missed by this simple rule.
Our learned model on the same features catches, at exactly the same specificity, zero point six five — so a bit more. But the real advantage is: the model has a freely choosable operating point, the rule is a fixed point. So you can deliberately trade more sensitivity for more false alarms, as needed.
43 · The further along the path, the more data — and the stronger
Let's go through the intervention points in order — all as discrimination, as A U R O C. Right at the entry, when the case comes in, you have only the demographics, age and sex. On their own they already separate at zero point six eight. Important distinction: this is not the clinical suspicion rule from before — that one, young plus event, we measured separately as a classifier and reported as sensitivity. Here it's about the raw demographic baseline tendency as discrimination.
Add the history, that is the clean clinical presentation, and it rises to zero point eight one — and that entirely without telltale raw-text words, using only curated features.
On suspicion of a stroke, the very first image is a non-contrast CT. You could also train an AI on it to flag Moyamoya hints already here. For Moyamoya we haven't yet quantified this, but it's an obvious, very early intervention point. By the way: foundation models on exactly such non-contrast CTs, though for brain hemorrhages, we examined in a separate article — you'll find it linked below the video.
On the regular cross-sectional image the image AI is, confound-controlled, at zero point eight four — and, the decisive point, at zero point eight nine for the atypical, older patients the demographics rule misses.
And at the angiography, with vessel features like the bilateral stenosis, it rises to zero point eight six. But that's already confirmatory, because the angiography is only done once the suspicion is there anyway.
And beyond that there would be further sources, genetics or lab, which we didn't exhaust here at all. The core message: the later along the path, the more data and the stronger — but the earlier you flag, the more broadly and cheaply you intervene.
44 · The detection funnel — how many additional cases
Let's put it all together into one flow, with measured numbers. Of around a hundred and fifty Moyamoya cases a year, today's clinical rule catches about ninety-three — its sensitivity is zero point six two. Around fifty-seven are missed, above all the atypical, older ones. But exactly their routine scans already exist, and on those the image AI is strongest, zero point nine for the atypical ones. At a high-sensitivity operating point it catches most of them, roughly thirty-eight additional cases, and puts them before the specialist. The angiography is then done only for the flagged high-suspicion cases. Bottom line, detection rises from about sixty-two to around eighty-seven percent — without a single additional scan. All under the assumption of a realistic case distribution, and it's an exploratory calculation, not regulatory proof.
45 · What the additional cases are worth
And what is one such additional early-detected case actually worth? Let's figure it out roughly, back-of-envelope — with solid anchor data, but many assumptions one would have to establish concretely. The bypass, according to the Japanese Moyamoya study, markedly lowers the event rate over five years, from around thirty-four to fourteen percent. Set that against the pure acute costs of a stroke — roughly forty-three thousand euros over the lifetime — and subtract the operation costs, and on a narrow five-year view there's even a small net cost, about minus eleven thousand euros. But that's exactly the wrong lens for Moyamoya. Because Moyamoya mostly strikes young people, and a prevented disabling stroke saves not five years but decades of care, lost labor, and quality of life. Factor that in, and the net benefit is clearly positive, on the order of several tens of thousands of euros per case. To be very clear: this is a back-of-envelope calculation, not a health-economics appraisal — the real numbers hinge on operation costs, risk, age, and region, and would have to be validated concretely. But the direction is unambiguous: the value lies in the long-term avoided disability of young patients.
46 · How you roll it out — from service to medical device
How would you build this concretely, without needing an approved medical device on day one? In three phases. Phase one is a pure service offering: you take the cases a simple, guideline-driven prefilter sifts out anyway, and have an expert look over exactly this preselection. For each one they say: Moyamoya, yes or no. That costs only specialist time and creates something valuable.
Namely a clean, expert-labeled data basis — no more noisy keyword, but real judgments. On it we train, in phase two, the classifier. Now it stands on firm ground.
And in phase three the tables turn: the image-driven classifier finds additional Moyamoya cases the simple prefilter would have missed, and puts them before the physician. So the service gradually becomes a medical device that sifts out Moyamoya far better than the original, rigid rule. The service funds the data, the data make the product, the product beats the rule.
47 · What's missing: a realistic test cohort
There remains an honest gap, larger than this one case. If we claim a model finds Moyamoya among entirely ordinary patients, then you'd have to test that on exactly the mix that actually arrives at the hospital: the rare cases against thousands of ordinary ones — above all the common look-alikes such as the acute stroke with which Moyamoya is often confused. But such ordinary comparison cases in that quantity we don't have. The obvious shortcut — simply having a language model write the common cases — doesn't hold: a generator writes textbook ideal cases that separate artificially cleanly, while real patients overlap. It's precisely this overlap that makes the clinical task hard and valuable in the first place, and it can't be faked. The proof that a model really finds Moyamoya in everyday practice therefore needs a realistic, prospectively collected cohort that reflects actual clinical practice — synthetic data are good for checking your own pipeline, not as proof.
48 · From signal to a safe medical device
Now the path from this signal to something you may truly entrust patients to. Everything so far rested on public, messy data — a real medical device needs more.
49 · And on to a real medical device?
A final, honest point that stands over this whole case study. The public data we worked with here are relatively messy — and as we've seen, quite a few hidden confounds remain in them that we could never fully filter out.
For a real medical device that's not enough. You'd first have to create a clean, prospectively collected data basis — and then test the model in everyday clinical practice in a study. Only that way can you be reasonably sure the AI does no harm.
And that's exactly what the approval pathways are for, the European M D R and the American F D A: they require proof of benefit and safety before such a system is let loose on real patients. Our numbers here are hypotheses and a feasibility signal — the beginning of this path, not its end.
50 · What such a system could deliver — in numbers
Let's summarize the benefit the way a decision-maker sees it — on the one example we worked through. A quiet image filter could raise Moyamoya detection from around two thirds to nearly nine tenths, without a single additional scan — in the Japanese care network roughly thirty-eight additional early-detected cases a year. The effort stays manageable: per alert one additional specialist glance, around thirteen reviews per real find. And each early-detected case is worth, over the lifetime, roughly forty thousand euros, above all through avoided disability in young people. All an exploratory projection, not regulatory proof — but the order of magnitude shows why the effort could be worthwhile.
51 · What all of this means
Let's step back. At the start was a person who for years doesn't know what they have — for millions with a rare disease that's everyday reality. The great hope is artificial intelligence. What we've seen is more sober and at the same time more encouraging than the hype. There is no single right AI. Which one helps depends on the data situation. Where a treatable disease recurs often enough that a few examples exist, a small, cheap model even beats the large language model. Where there's only the worldwide one-off case, it takes knowledge and language — and much remains open. What mattered was the discipline: every pretty number we tested against leakage, against the base rate, and against data provenance — and some broke in the process. What remains is no miracle cure, but something concrete: a quiet second reader that runs along on the images and reports produced anyway, recognizes the right cases, and hands them to an expert — in parallel with normal treatment, without replacing anyone. For the patient that can mean: an answer years earlier, and an operation that prevents a stroke. That's exactly what makes the effort worthwhile — and the honesty that goes with it.
52 · More on this in the article
The full methodology, all the numbers, and the checked sources you'll find in the article right below this video. Thanks for watching, and until next time.
What AUROC actually means
AUROC can be read as a pairwise ranking test. Draw one positive and one negative case at random. How often does the model assign the higher score to the positive case? An AUROC of 0.5 is random ordering. An AUROC of 1.0 is perfect ordering. An AUROC of 0.835 means, in simplified terms, that the positive case ranks higher in about 83.5% of such pairs.
AUROC does not say that a score of 0.8 means an 80% probability. It also does not tell us how many false alerts a clinical workflow would receive. Those questions require calibration, a threshold, and the disease frequency in the target population.
For diagnostic shortlists, top-k can be closer to actual use. Top-1 asks whether the correct diagnosis ranks first. Top-10 asks whether it appears among the first ten suggestions. A model may therefore support search even when its first answer is often wrong.
HPO codes show how far a simple representation can go
The first experiment deliberately starts with structured findings. This tests whether a complex encoder adds anything or whether a transparent weighted feature list is sufficient.
HPO TF-IDF top-1 0.796 · multi-hot AUROC 0.991 · TF-IDF AUROC 0.988In depth: multi-hot, TF-IDF, and why an encoder is not automatically better
In a multi-hot representation, every HPO term receives a column. A present finding is one, an absent finding is zero. TF-IDF starts from almost the same representation, but reduces the influence of common, weakly discriminative terms and increases the weight of rarer ones. For HPO, it is essentially a normalised, weighted multi-hot vector.
Each present HPO term moves particular diagnosis scores up or down. The calculation remains directly inspectable.
The pipeline ablation shows that code count alone does not explain the result. A count-only model reaches AUROC 0.716. Multi-hot reaches 0.991, TF-IDF 0.988, and a cardinality-matched multi-hot control still reaches 0.968. Which findings are present matters much more than how many were recorded.
A language encoder also consumes compute during inference and adds assumptions about language to already discrete codes. HPO is therefore a control case rather than an argument for a more complicated encoder. When experts have already defined the features, a linear model may be the appropriate tool.
Text and images answer different parts of the same diagnostic question
MMRareBench pairs clinical narratives and published figures from the same cases. This makes a fair modality comparison possible because text, image, and fusion see the same patients and candidate diagnoses.
Top-1: text 0.309 · image 0.211 · simple fusion 0.343 · confidence intervals overlapIn depth: what text, image, and their mathematical combination mean
A text encoder creates a vector whose coordinates summarise recurring linguistic and semantic patterns. Each image produces an image vector. If a case contains several figures, their vectors are averaged into one case representation. A linear model then assigns a score to each candidate diagnosis.
Text plus image does not imply mysterious multimodal reasoning here. The calibrated scores from two models are combined. When the narrative broadly supports a diagnosis and the image raises the same diagnosis, it moves up the joint ranking. When the modalities disagree, the learned weighting decides how much each contributes.
Text performs better on average because a narrative spans multiple organ systems and the disease course. Images help selectively when morphology is visible. Fusion rises numerically to 0.343, but the uncertainty intervals overlap. The defensible conclusion is not “fusion wins.” Images can reorder a text-derived shortlist in selected cases.
These values cannot be ranked directly against the HPO experiment. The cohorts, candidate sets, and selection processes differ. A fair three-way comparison would require the same patients represented by HPO, prediagnostic prose, and images.
A model can learn data origin while appearing medically plausible
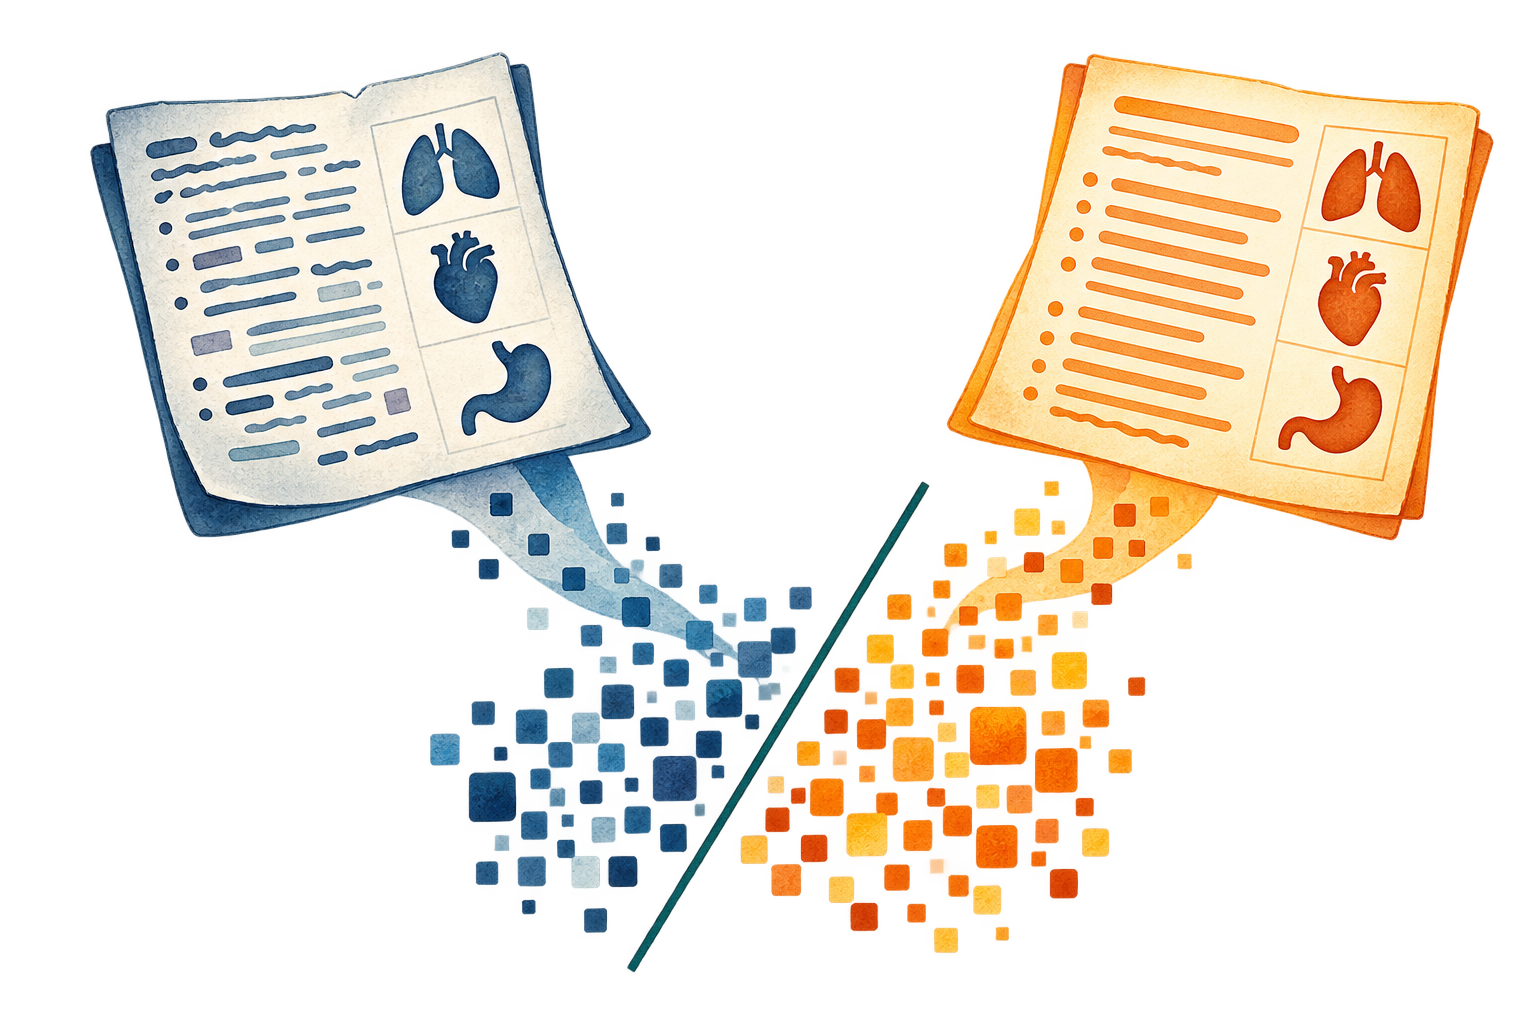
Synthetic cases and LLM rewrites only appear to solve data scarcity. If real and generated examples use different language or coding patterns, the model can recognise the production process instead of the disease.
In depth: word bias, linear separators, and why similar content can occupy a different distribution
The decisive test keeps the medical case as constant as possible. Three rewrites were created for each of 474 original cases. Word TF-IDF, character patterns, embeddings, and even form-only features still separate original and rewrite almost perfectly. The separator uses recurring vocabulary, sentence structure, section length, and formatting.
Each word or form feature is one coordinate. Many small weights add up. Once the sum crosses the boundary, the model assigns the document to a provenance.
“Content preserved” is not enough either. About 88% of clinical entities survived in the audited subset, while roughly 20% of pairs gained additional entities. Numbers and temporal statements survived much less reliably. With Qwen embeddings, the top-1 diagnosis changed for 36% of cases even though top-10 remained roughly stable.
The same pattern appears after LLM generation and HPO mapping. Original and processed HPO cases are separable at AUROC 0.993. Synthetic data should therefore not be treated as an interchangeable clinical population. It can serve as a stress test when provenance and target signal are evaluated separately.
Two further tests place the signal. It generalises: a separator trained on rewrites from one language model flags a different model's rewrites at almost the same AUROC, and the writing model itself is identifiable from the text about 91% of the time against a 50% baseline — a general property of machine-written prose, not one tool's handwriting. It is also largely cosmetic for the diagnostic task: once wording, text length, and the number of findings are equalised — each reduced to near chance as a separator — a rare case still separates from a common one by clinical content alone. The production signature is highly detectable, yet on its own it barely moves the medical ranking.
In depth: why Moyamoya is a useful test case
The general experiments reveal common failure modes in rare-disease AI. Moyamoya turns them into one concrete clinical chain. The disease typically narrows the terminal intracranial carotid arteries. Fine collateral vessels develop in response and create the angiographic appearance that gave the disease its name. Patients may present with TIA, ischaemic stroke, headache, or intracranial haemorrhage.
The useful stroke-workflow question is not whether a model recognises a textbook figure. It would need to distinguish Moyamoya from plausible vascular alternatives and flag an existing CTA or MRA for a second expert review. That narrower task determines the cohort, controls, and metrics.
The useful control is a vascular mimic, not an arbitrary normal image
An easy benchmark would compare Moyamoya angiograms with photographs or unremarkable scans. The relevant test instead includes vasculitis, atherosclerosis, dissection, RCVS, and other neurovascular differential diagnoses.
In depth: cohort, modality, and intended point of use
The data come from published case reports. This provides access to rare positives but introduces publication selection, mixed modalities, and retrospectively selected figures. The current labels come from keyword-based candidate retrieval and still require clinical adjudication.
All cases and images from one article stay in the same split. Without this grouping, a model might recognise article layout, scanner overlays, or image processing. That would resemble medical generalisation while actually measuring repetition.
The realistic point of use would be CTA or MRA in young patients with cryptogenic or atypical stroke. Non-contrast CT does not reliably show the characteristic stenoses and collaterals. Public acute NCCT datasets with Moyamoya positives and angiographic reference are currently missing.
Ranking, probability, and image signal require separate tests
Nested evaluation first asks whether the full model-selection procedure ranks new articles. Calibration then tests the probabilities. Crops and clinical variables probe what may be driving the signal.
In depth: nested CV, calibration, vessel ROI, and clinical confounding
Nested cross-validation separates model choice from evaluation. In each outer round, one article is held out. Encoder and calibration decisions use only the remaining articles. The procedure is then evaluated on the held-out article. This measures the complete selection process rather than the best variant chosen after seeing the results.
AUROC 0.835 means that a randomly selected Moyamoya candidate receives a higher score than a randomly selected vascular mimic in about 83.5% of pairs. It does not mean that a score of 0.8 represents an 80% probability.
Calibration is similar to weather forecasting. If a forecast says 20% rain on one hundred days, rain should occur on roughly twenty of them. The raw image model ranks cases reasonably but is overconfident. Platt calibration learned only from training data improves locked-test log-loss skill score to +0.206.
+0.206 means about 20.6% less probabilistic error than assigning every case the same training prevalence.
The location tests fit the anatomy. Full-image AUROC is 0.850. Centre crop falls to 0.815 and tiles to 0.719. A vessel ROI reaches 0.861. Age and sex alone reach 0.824 because the selected cases are not demographically neutral. Image plus clinical variables reaches 0.876. This suggests complementary image information but does not prove independent generalisation.
The apparently strongest text result, 0.954, is excluded. Terms naming Moyamoya, bypass surgery, SPECT, acetazolamide, and specific vessel findings come from completed diagnostic work-up. A fair text experiment requires genuinely prediagnostic complaints and findings.
Epidemiology determines how often a useful signal can help
The same model produces a different positive predictive value and reaches a different number of people across populations. Japan and Europe make this dependence visible.
In depth: base rate, review burden, treatment pathway, and missing validation
In a network serving 7.6 million people, an incidence of 0.07 per 100,000 corresponds to roughly 5.3 new cases per year. At the Japanese rate, it would be about 137 to 182. Applying the same calculation to Greater Tokyo, around 37.4 million people, gives roughly 670 to 900 new cases each year. This is disease volume, not automatic model detections.
Population and incidence are epidemiological anchors. Reach, local missed-case rate, and transferable sensitivity require measurement in the care system.
Base rate also changes the meaning of an alert. As in security screening for an extremely rare target, even a reasonably accurate detector may flag more harmless than true cases. At the illustrative operating point of 0.80 sensitivity and 0.809 specificity, positive predictive value would be only 0.8% at 0.2% prevalence. That is about 120 reviews per true case. At 2% prevalence it is about 13.
A useful point of use should therefore enrich the population, for example young people with cryptogenic or atypical stroke who already underwent vascular imaging. The model would provide silent second reading rather than population screening.
A signal must lead to expert confirmation, haemodynamic assessment, and an individual treatment decision. In the Japan Adult Moyamoya Trial, annual rebleeding in adults with haemorrhagic Moyamoya fell from 7.6% to 2.7% with direct bypass. The evidence was statistically marginal and does not apply to every disease form.
Clinical claims still require adjudicated labels, strictly matched CTA or MRA controls, classification after OCR masking, external calibration in a real stroke population, and retrospective expert re-reading to measure the local missed-case rate.
Epidemiology: Liu et al., 2024 and Birkeland et al., 2020. Treatment: Japan Adult Moyamoya Trial.
What the experiments add up to
The Moyamoya case study brings the earlier findings together: a measurable image signal may support targeted specialist review, while its value depends on data quality, prevalence, and the care pathway.
Rare-disease AI does not need one universal winning architecture. Structured codes can be well served by simple linear models. Clinical prose carries more context but also much more provenance and post-diagnostic information. Images add visible morphology but demand strict control of modality, cropping, and publication artefacts.
The common thread is signal verification. Every strong number needs four answers: What information entered the model? Which cases formed the comparison? Which shortcut could the model use? How does the base rate change deployment?
Moyamoya is not a decorative example. It is the case study in which these questions meet. The image signal is interesting. The text result is leakage-inflated. Calibration is feasible. Clinical value remains a testable hypothesis.